Benefits to the Local Economy:
Michael Rucker from Scout Clean Energy says in his guest opinion (Tri-City Herald, 4/2/2020) that the construction of the Horse Heaven Wind farm will create “up to three hundred jobs during construction and up to sixteen permanent family-wage jobs once operational”. He further claims “At current levy rates, the full buildout of the project could generate $60 million in tax revenue for Benton County over the 25 year lifespan”.
The financial impact to the Tri-Cities could be $ 2.4 million per year ($ 60 million over 25 years) while creating up to 16 permanent jobs. This is in contrast to the impact of tourism to the local economy:
According to Gretchen Guerrero from the Tri-Cities Visitor Bureau, ” visitor spending in 2019 was $560.2 million creating 6370 jobs in Benton and Franklin Counties. $54.5 million in local and state tax receipts were collected; $19.3 million in tax receipt were retained locally“. Note that this statement does not include the jobs and taxes in the Prosser and the Benton City region from wine sales and lodging .
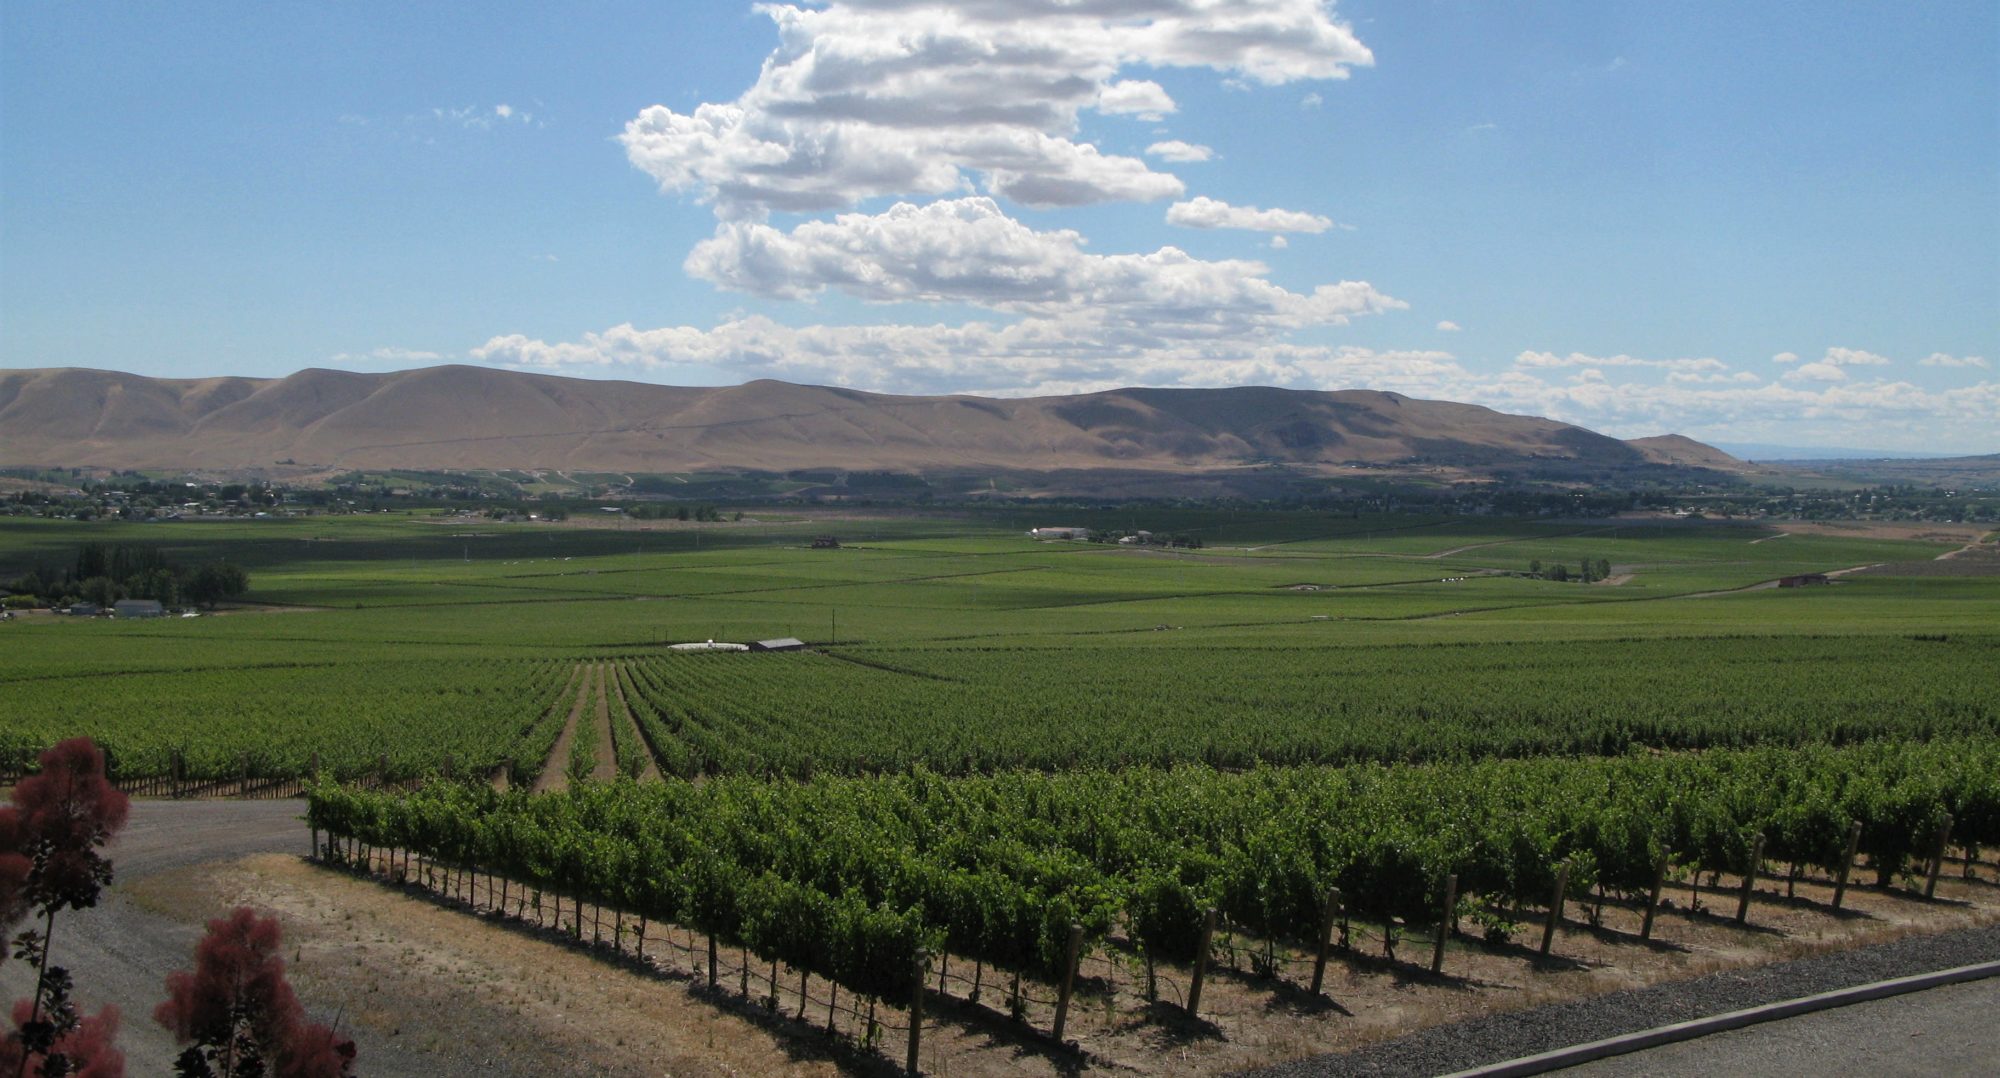
Many folks from the Westside like to visit our region to enjoy the warm climate, play golf and visit our wineries, and admire the panoramic views of our ridges and hills; they probably don’t want to see a forest of whirling blades and blinking lights.
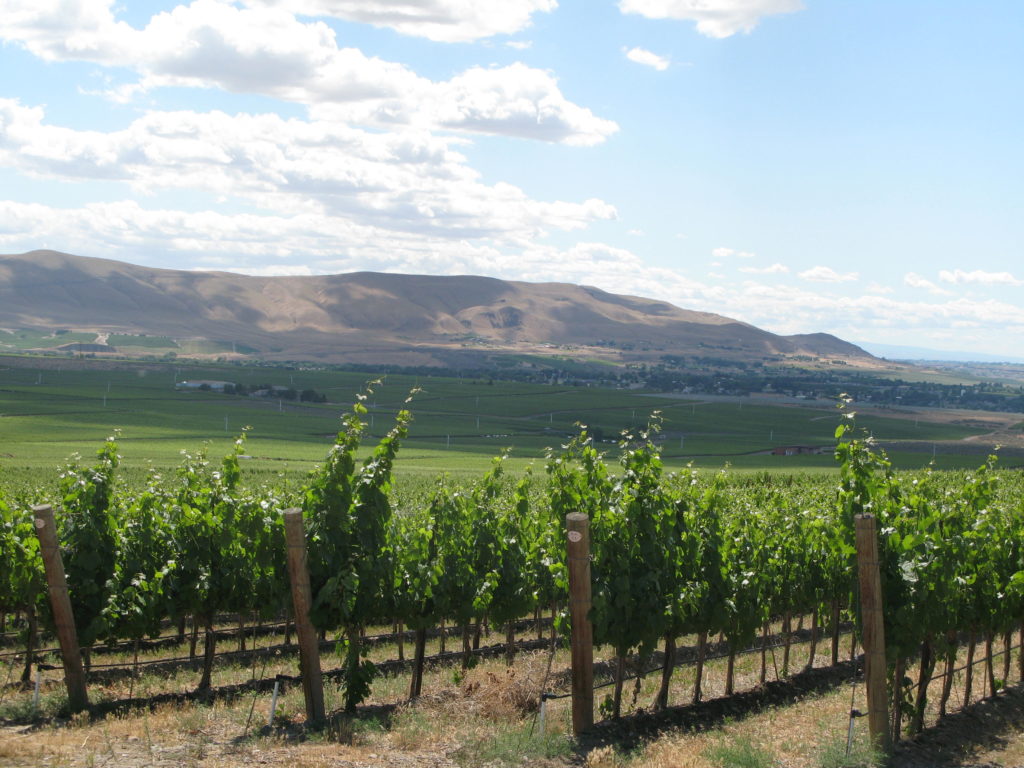
View from Red Mountain with the Horse Heaven Hills in the Distance. Tourism is big business in the region.
The Horse Heaven Hills Wind Farm Project is the Wrong Place
According to Dr. Jim Conca, the real problem is that Scout Clean Energy is building this wind farm in the wrong state (see Opinions).
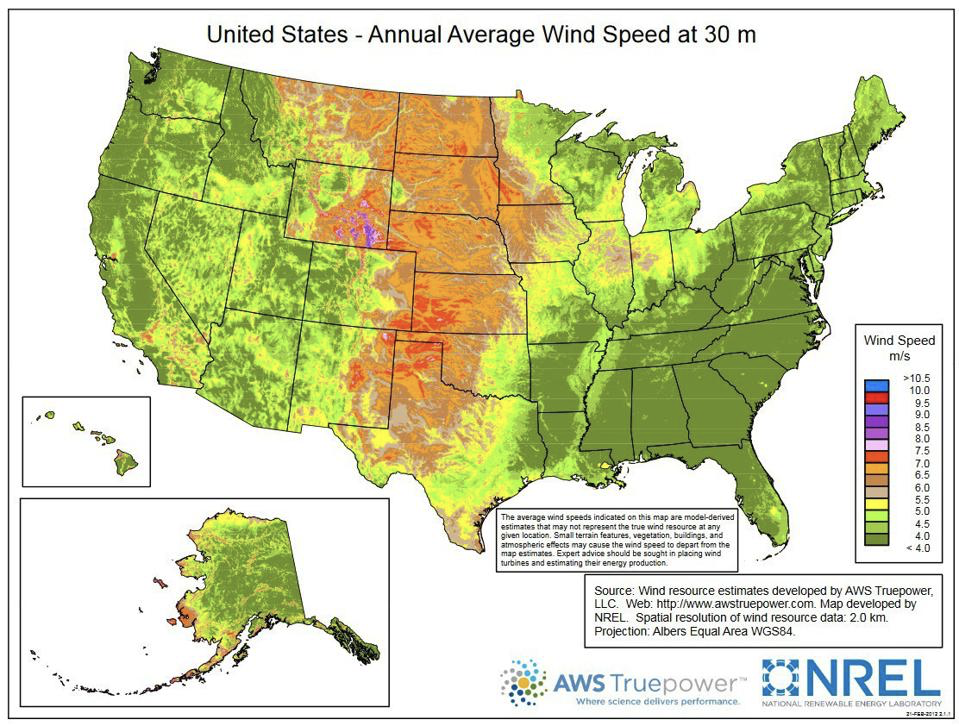
Tornado Alley is the optimal place for wind turbines in the United States (see figure below where average wind speeds exceed 6.5 m/s), pushing capacity-factor-a-measure-of-reliability to > 50%, and has made wind the second largest generator of electricity in Kansas, South Dakota and Iowa, where they actually displace coal power.
The capacity factor is the percentage of the time a system is supplying its nameplate or installed capacity. The nameplate capacity times the capacity factor equals the actual output of the generating system.
According to the Scout Clean Energy plan the new farm’s nameplate capacity will be 1,150 MW. Since the capacity factor for this wind farm is only 30%, the generation will actually be only 345 MW operationally. Wind turbines in this area have an average capacity factor of only 27%.
In comparison, the capacity factor for the Columbia Generating Station, our local nuclear power plant, is 98%. With a nameplate capacity of 1,207 MW, it’s producing about 1,180 MW continuously, over 3 times that of the similarly-sized proposed wind farm.
Wind Farms get Preferential Treatment
According to Bill Gordon, retired board member of the Franklin County PUD, “If the region is long on electrical generation then the last built generator is the first to shut down. As it is now BPA asks Energy Northwest to back off production. They call the economic dispatch. If that isn’t enough reduction then BPA asks the wind farms to reduce their production. When this happens BPA then pays the lost production tax credit to the wind farms to make up what they would have received from the Government. This is like a developer going into Prosser and build a 300 unit apartment building but they only needed 100 units. So they town then pays the developer the rent he would have gotten for the vacant apartments, even though they didn’t have renters for them”.
Wind Power is not always Green Power
As Dr. Jim Conca writes, Scout Clean Energy claims that this wind farm will offset 3.5 million tons of CO2, but that’s not true either. There is little fossil fuel in Washington State, which is 70% hydro, 8% nuclear, 13% renewables (mostly wind), 5% gas and 4% coal, with the latter from a single coal plant scheduled to be retired in 2025.
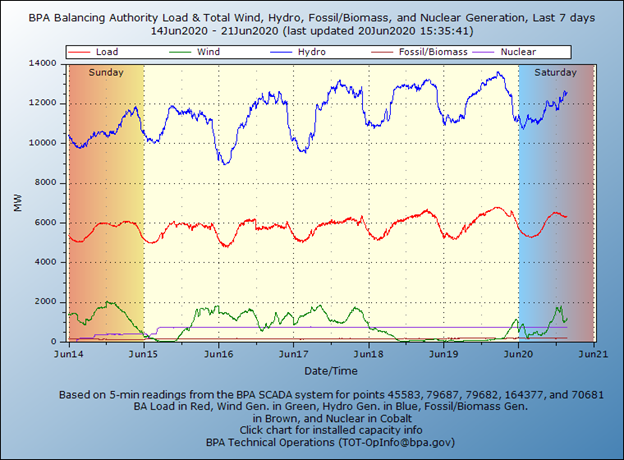
This new Scout Clean Energy wind power will only displace hydro, another renewable, thus having no effect on carbon emissions, no matter where the energy ends up. We know this because it’s what happens all the time in this state. The figure below is an example of a weekly electrical load map from the Bonneville Power Administration, who is the main system operator in the Pacific Northwest.
The grid must be closely balanced between load, or power draw off the grid, and the power coming onto the grid from all energy sources, as can be seen in this BPA load graph below.
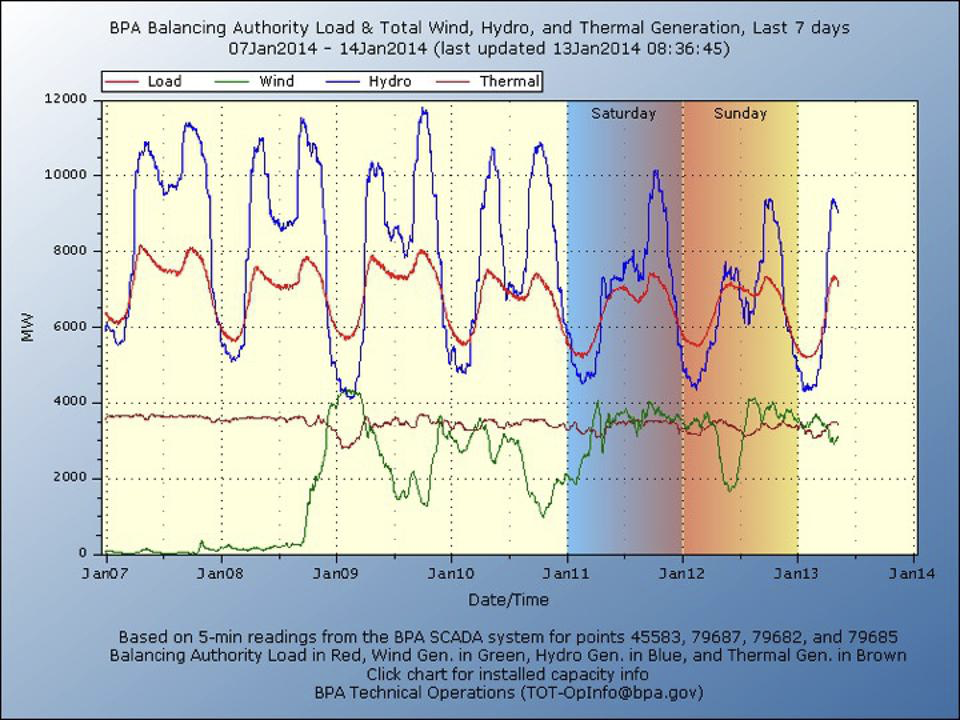
Load in this graph is in red, and the energy sources are blue (hydro), green (wind) and brown (thermal – coal, gas and nuclear). Notice that hydro is used almost exclusively to load-follow and balance the grid. When load goes down, or more energy comes onto the grid like wind, hydro drops. When load goes up or wind dies away, hydro increases.
Whenever energy from wind comes onto the grid, hydro generation is dropped or curtailed, by spilling water over the dams instead of through the turbines. This common practiced. And will continue, and even increase, if the Scout Clean Energy project goes forward.
Wind Farms Produce very Intermitted Power
Wind farms don’t always generate electricity; this article was written on June 20, a somewhat blustery, rainy spring day, and the green curve in the diagram below shows that the wind farms barely produced any electricity that day or the two days before. The pictures from the Nine Mile wind farm were taken on June 18, but only 11 of the 23 turbines were spinning somewhat despite a noticeable breeze. Every megawatt of electricity generated by windmills in the Mid-Columbia must be backed up with dispatchable generating sources to ensure electricity when the wind is not blowing but demand is high during the hottest days or coldest nights of winter. Wind energy is not a reliable energy resource until we have the capacity to store huge amounts of electricity. The Generation diagram from BPA is at: https://transmission.bpa.gov/Business/Operations/Wind/baltwg.aspx
Wind Power is Subsidized Power; What happens when the Tax Credit Expires?
From the Department of Energy website WindExchange, “the Production Tax Credit (PTC) provides a tax credit of 1¢–2¢ per kilowatt-hour for the first 10 years of electricity generation for utility-scale wind. The alternative Investment Tax Credit (ITC) provides a credit for 12%–30% of investment costs at the start of the project and is especially significant for the offshore and distributed wind sectors because such projects are more capital-intensive and benefit from the up-front tax benefits. In December 2019, Congress passed extensions of the PTC and ITC.”
As a result, the current wind energy PTC was extended through 2020. Wind projects will qualify if developers begin construction before the end of the designated period.
| If construction begins: | The estimated allowable tax credit is: |
|---|---|
| After Dec. 31, 2016 | 1.9 cents/kWh |
| By Dec. 31, 2017 | 1.8 cents/kWh |
| By Dec. 31, 2018 | 1.4 cents/kWh |
| By Dec. 31, 2019 | 1 cent/kWh |
| By Dec. 31, 2020 | 1.5 cents/kWh |
Wind Farms Affect Property Values
Many homes on the west side of the Tri-Cities-Cities from Southridge in Kennewick, to South Kennewick, Reata West, Badger Mountain South, all the way to Horn Rapids have beautiful views of western sunsets over the Horse Heaven Hills. It is easy to speculate that a 24 mile long industrial complex on this horizon will affect demand for these view properties. A research study in Germany looked at property values and wind farms; it found that the values dropped from 9-14 % when the properties were facing the wind farm (Energy Economics, 55, March 2016, p. 79-91, available from Google Scholar). Our real estate market is different from Germany but it also follows a similar supply and demand that is affected by factors like desirable views. Real estate development in the Badger Canyon area is large and growing rapidly, and the potential impact of such a property value loss could over time be more than the potential benefit of the Horse Heaven Hills wind farm itself.
A large ad in the Tri-City Herald on March 28, 2021 by Scout is is saying “Unfortunately, there is a great deal of misinformation regarding our projected wind energy in general which can lead to concern and confusion about what is being proposed”.
Then they go on to say:”How are property values impacted? The most comprehensive study to date prepared for the US Department of Energy concluded, we find no statistical evidence that home values near turbines were affected in turbine postconstruction or post- announcement/pre-construction periods”.
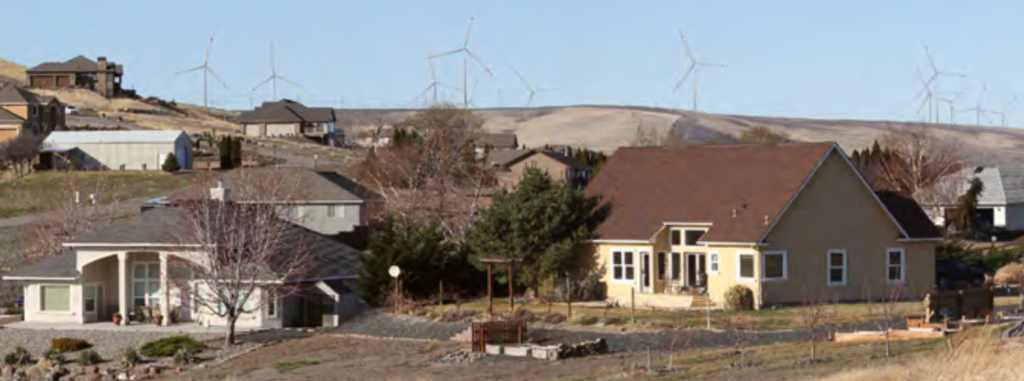
Really, no effect on the property values of the view homes in Badger Canyon? This sounds like another half-truth taken out of context. The picture below is an enlargement from Scout’s own application with the panorama picture enlarged to show the houses and the wind towers; it’s not a pretty sight! No effect on property values and property taxes?
 Users Today : 1
 Users Yesterday : 14
 Users Last 7 days : 92
 Users Last 30 days : 336
 Users This Month : 301
 Users This Year : 1310
 Total Users : 11928
 Views Today : 1
 Views Yesterday : 52
 Views Last 7 days : 248
 Views Last 30 days : 679
 Views This Month : 623
 Views This Year : 3680
 Total views : 22514
 Who's Online : 0